
Entering a new market is a significant undertaking for any business. Success depends on measuring the right factors, whether launching a new product, targeting a different customer segment, or expanding geographically. GTM KPIs—key performance indicators aligned with your go-to-market strategy—provide critical insight. They distinguish companies that adapt and lead from those that exhaust resources without understanding stalled progress. Without a robust GTM KPI framework, even well-planned market entries can fail before issues become apparent. This guide outlines the most important GTM KPIs, how to structure them, and how to use them for better decision-making.
What Are GTM KPIs and Why Do They Matter?
GTM KPIs measure the effectiveness of your go-to-market strategy during entry or expansion. Unlike standard business metrics focused on overall health, GTM KPIs emphasize near-term momentum, real-time conversion, and market responsiveness. They act as leading indicators, giving early warnings for timely corrections and cost control. GTM KPIs offer a cross-functional lens, integrating insights from marketing, sales, product, and customer success so teams can quickly identify if issues stem from demand generation, sales execution, or product-market fit.
GTM KPIs also drive organizational alignment. When all teams—marketing, sales, customer success, and product—work toward the same clearly defined metrics, decision-making becomes faster and more consistent. Data, rather than hierarchy, guides resource allocation, and course corrections occur as market conditions require. Defining metrics such as qualified leads, won deals, or retained customers prompts valuable discussions that reveal and resolve hidden misalignments. Building a shared GTM KPI framework is both an organizational and analytical effort, establishing a common language that enables high-performing teams to move quickly and stay coordinated. These metrics are only as effective as the assumptions behind them, particularly how well you define your target audience and market segments from the outset.
The Five Pillars of a Strong GTM KPIs Framework
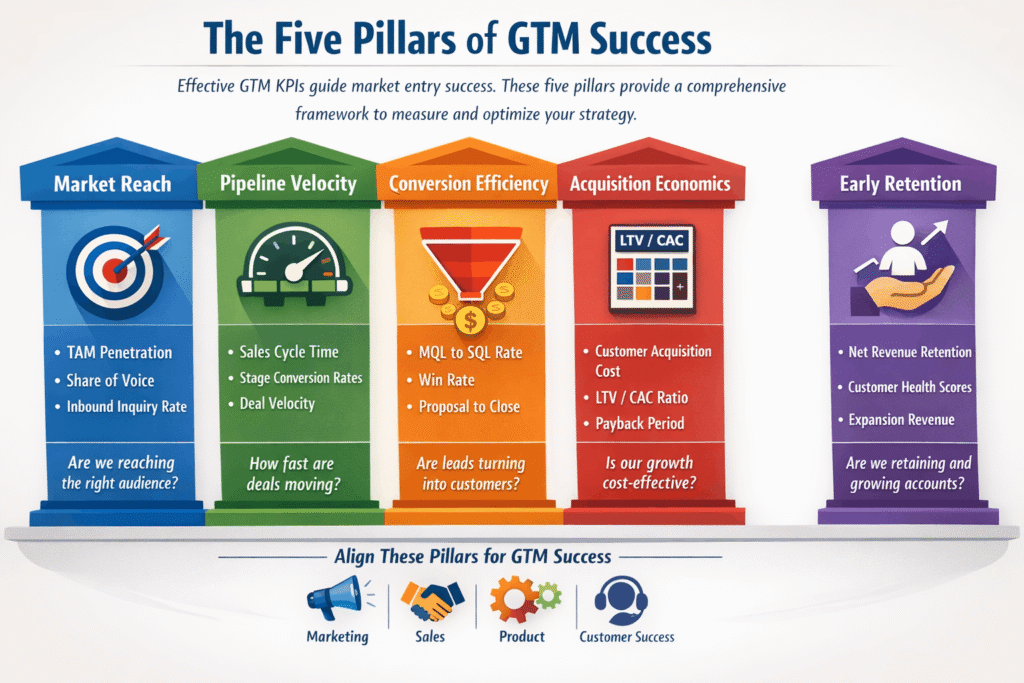
A strong GTM KPI framework rests on five pillars: market reach, pipeline velocity, conversion efficiency, customer acquisition economics, and early retention signals. Each pillar addresses a distinct phase or aspect of market entry. Together, they provide a full view of go-to-market performance, highlight breakdowns, and guide investment. Organizing metrics around these pillars helps avoid tracking excessive, disconnected data. This prevents noise rather than insight. Each pillar answers a key strategic question. Collectively, they provide a clear narrative of your market entry. The following sections examine each pillar in detail.
Pillar 1: Market Reach KPIs
Market reach KPIs address whether you are engaging your intended audience. They measure the size and quality of your initial audience and the effectiveness of outbound and inbound efforts. They also show brand resonance within your target segment. Without strong reach, downstream GTM KPIs suffer. This is due to insufficient qualified leads at the top of the funnel. Key metrics include total addressable market (TAM) penetration rate, share of voice in your target segment, branded search volume growth, and inbound inquiry rate. TAM penetration shows what percentage of your defined market has been reached through activities such as campaigns, events, content, paid media, or sales outreach. While straightforward, it quickly reveals if your reach is sufficient.
Share of voice shows how well your brand’s presence in target-market conversations is relative to competitors, which is particularly important in B2B markets where awareness builds gradually. Branded search volume growth is a valuable but often overlooked metric; increased searches for your brand indicate effective messaging and growing interest. A flat or declining branded search early on signals an issue that requires immediate attention. Inbound inquiry rate, or the number of unsolicited contacts from target accounts, directly reflects whether your positioning is generating genuine interest in the new market.It’s not just in aggregate, but also broken down by channel and customer segment. A high overall reach number driven almost entirely by one channel represents a fragility, not a strength, because any disruption to that channel leaves your market entry exposed. Similarly, focusing on concentrated non-ICP accounts indicates that your targeting is off, regardless of how impressive the raw volumes appear. Segmenting your GTM KPIs by reach gives you the granularity needed to make confident, informed channel investment decisions in real time, rather than waiting for pipeline data to catch up weeks later.
Pillar 2: Pipeline Velocity KPIs
After generating interest, pipeline velocity KPIs track how quickly that interest turns into revenue opportunities. Pipeline velocity measures how fast potential revenue moves through your sales process. It indicates the alignment between your sales approach and buyer decision-making. Slow pipeline velocity means deals are stalling. This often happens due to misalignment in messaging, qualification, or process. The standard formula combines qualified opportunities, average deal value, win rate, and average sales cycle length. Monitoring this metric weekly during market entry gives a real-time view of your GTM engine’s health. Changes in the composite metric highlight where further investigation is needed.
In addition to the composite velocity score, several pipeline GTM KPIs are critical. Pipeline coverage ratio is the ratio of total pipeline value to your revenue target. This should typically range from 3x to 4x for most B2B businesses, but this varies by sales cycle and contract value. Stage-by-stage conversion rates reveal where deals stall. This supports targeted sales coaching and messaging improvements. Time-in-stage metrics show how long opportunities stay at each funnel stage. This helps detect bottlenecks early. Average deal size by segment and channel shows whether the market values your offering as expected. Together, these KPIs give a comprehensive view of your revenue engine’s performance, going beyond aggregate pipeline volume.
A common mistake during market entry is equating pipeline volume with quality. Many early-stage opportunities may appear promising, but if they do not progress, convert, or align with your ICP, they hide real problems. Define “qualified” precisely and use this standard across the sales team. Otherwise, pipeline velocity KPIs lose value. A small, high-quality pipeline is more useful than a large, unqualified one. Maintaining this quality ensures velocity metrics matter.
Pillar 3: Conversion Efficiency KPIs
Conversion efficiency GTM KPIs assess how effectively your go-to-market approach turns interest into customers. These metrics are central to market-entry measurement because they directly link marketing and sales investments to revenue outcomes. Poor conversion efficiency often goes unnoticed, with teams investing in top-of-funnel activities while structural issues in the funnel prevent results. Key metrics include lead-to-opportunity rate, MQL-to-SQL conversion rate, opportunity-to-close (win) rate, and proposal-to-close rate. Each highlights a specific stage in the buyer journey, and declines indicate targeted problems. For example, a low MQL-to-SQL rate often signals misalignment between marketing’s qualification criteria and sales’ assessment of buyer readiness.
A low proposal-to-close rate often points to pricing challenges, competitive positioning gaps, or late-stage sales execution issues. Win rate by competitor is especially valuable during market entry, as it reveals strengths and vulnerabilities against specific alternatives. In the first 90 to 120 days, review these conversion KPIs weekly, as early conversion issues are often systemic and can escalate quickly if left unaddressed. Addressing bottlenecks early is significantly less costly than correcting them after substantial investment.
Cohort analysis enhances conversion efficiency measurement by revealing trends that aggregate rates miss. By grouping leads by acquisition date, channel, or campaign and tracking their progress, you can assess whether conversion efficiency improves as your approach evolves. This also identifies which channels or campaigns yield higher-converting leads, supporting better budget decisions. Win/loss analysis—structured interviews with recent prospects—adds qualitative insights that quantitative KPIs cannot provide. Understanding both wins and losses is essential for a robust GTM measurement framework.
Pillar 4: Customer Acquisition Economics KPIs
Even with strong conversion rates, weak customer-acquisition economics can hurt value. GTM KPIs assess if customer acquisition costs align with long-term value. These metrics matter most during market entry, when costs rise due to low brand awareness and complexity. Customer acquisition cost (CAC)—total sales and marketing spend divided by new customers—is the core metric. CAC is usually higher during market entry, but it is acceptable if it declines and lifetime value assumptions hold. Tracking CAC by channel shows which acquisition strategies yield the best returns.
The LTV-to-CAC ratio is the most important unit economics metric for assessing market entry viability. A healthy ratio is typically 3:1 or higher in B2B subscription businesses, though benchmarks vary. Ratios below 1:1 indicate unsustainable value destruction, regardless of revenue growth. The payback period—the time to recoup CAC through gross profit—complements the LTV-to-CAC ratio by focusing on liquidity. Even a strong ratio can be problematic if the payback period is excessively long. The sales efficiency ratio, calculated as incremental ARR divided by prior-quarter sales and marketing spend, measures how effectively GTM investments generate revenue. Ratios above 0.75 indicate readiness to scale, while those below 0.5 suggest the need for optimization.
Accurate and consistent accounting is essential for GTM KPIs in acquisition economics. During market entry, there may be pressure to exclude costs such as executive time, onboarding, or partner fees from CAC calculations to improve reported results. Avoid this practice. The goal is to understand the true cost of growth and make informed investment decisions. Inflated CAC figures can lead to overconfident scaling and wasted capital. Honest measurement of these KPIs, even when results are uncomfortable, distinguishes companies that build sustainable go-to-market strategies from those that experience only short-term growth.
Pillar 5: Early Retention and Expansion KPIs
Retention and expansion GTM KPIs are often the most reliable indicators of market entry success. They assess whether acquired customers remain, grow, and derive real value from your offering. Poor retention among early customers signals fundamental issues with the product, positioning, or onboarding, and early detection enables timely correction. Net Revenue Retention (NRR) is the primary retention metric for subscription businesses, measuring the percentage of revenue retained from a customer cohort over time, including churn, contraction, and expansion. An NRR above 100% indicates your customer base is growing even before acquiring new customers, signaling strong product-market fit.
Customer health scores combine behavioral signals—such as product usage, feature adoption, support ticket volume, and engagement with customer success—into a single indicator of retention risk. During market entry, when working with a small initial cohort, health scores support proactive outreach before churn occurs. Time to value (TTV) measures how quickly new customers achieve their first meaningful outcome. Short TTV is linked to higher retention, stronger referrals, and lower support costs, while long TTV is a warning sign, especially in new markets. Reducing TTV should be a top priority for customer success teams during market entry.
Expansion revenue as a percentage of total new revenue indicates the strength of your relationships with early-market customers. When customers purchase additional seats, upgrade, or buy complementary services, it demonstrates satisfaction and trust. Tracking this metric from the outset shows whether your land-and-expand strategy is effective. Expansion revenue also supports the sustainability of your market entry, as it incurs lower acquisition costs than new customer revenue. Together, retention and expansion KPIs confirm not only your ability to acquire customers, but also to retain and grow them.
Building Your GTM KPIs Dashboard
With the five pillars established, the next step is to build a dashboard and review cadence that make GTM KPIs actionable in daily decision-making, not just for quarterly reports. The most effective dashboards have three layers: a headline view with four to six key indicators for leadership, a functional view by team and channel, and a diagnostic layer for identifying anomalies and trends. This structure serves both strategic and operational needs without overwhelming users. Select specific GTM KPIs based on your go-to-market approach, business model, and the hypotheses you are testing. There is no universal set of KPIs; the framework provides structure, but your context determines which metrics are most relevant.
Data hygiene and consistent definitions are essential for a reliable GTM KPI framework. Inconsistent metric definitions—such as varying qualification thresholds or attribution windows—undermine analysis. Before launching your measurement framework, document clear definitions for each metric, ensure your CRM and marketing automation systems capture accurate data, and establish a single source of truth. Review cadence is as important as metric selection. In the first 90 days, conduct weekly reviews to maintain alignment and enable rapid iteration. Monthly reviews should focus on trends, while quarterly reviews are best for evaluating and refining the metric framework as your market entry evolves.
Common Mistakes to Avoid When Tracking GTM KPIs
Several common mistakes can undermine GTM KPI frameworks, even with the right metrics in place. The most frequent is focusing on vanity metrics—such as website traffic, email open rates, or raw MQL volume—that are easy to report but do not correlate with market-entry success. This often happens when organizations lack a clear framework for measuring meaningful brand and business impact beyond surface-level indicators. Teams may prioritize metrics that look impressive rather than those that reflect real traction. To avoid this, always pair volume metrics with quality or efficiency metrics, such as MQL-to-SQL conversion rate or pipeline coverage ratio. Tracking too many KPIs is another issue; excessive metrics create noise and hinder decision-making. Limit your dashboard to a focused set of high-signal metrics and deprioritize less relevant data to enable fast, confident decisions.
Overlooking qualitative signals is another costly error, even for data-driven organizations. While GTM KPIs are quantitative, insights from win/loss interviews, onboarding feedback, and sales team observations provide context that metrics alone cannot. Quantitative data may show a drop in win rate, but qualitative feedback explains the reasons. Incorporating systematic qualitative data collection adds depth and turns metrics into actionable insights. Attribution errors are another common pitfall, especially with multi-channel campaigns. Misattributing results can lead to poor investment decisions. Use the most rigorous attribution model available, document its limitations, and validate conclusions with qualitative evidence before making significant budget changes.
Aligning GTM KPIs to Market Entry Phases
A mature GTM KPI framework adapts as your market entry progresses through different phases. Metrics that are most relevant in the first 30 days differ from those that matter at six months. In the initial discovery phase (30 to 60 days), focus on market validation metrics: Are you reaching the right audience? Are your messages generating interest? Are early conversations advancing? Key KPIs include meeting acceptance rate, ICP match rate on inbound inquiries, and early-stage opportunity creation, supported by qualitative feedback. During the pipeline-building phase (months two to four), conversion efficiency and velocity metrics become more important, as you have enough pipeline data to identify where deals progress or stall and adjust your approach accordingly.
In the scaling phase (from month four onward, after meeting validation metrics), customer acquisition economics and retention KPIs become the primary focus. At this stage, you are acquiring enough customers to assess retention and can evaluate CAC and LTV trends to guide scaling decisions. NRR for your first cohort is a key indicator of product-market fit. Treating your KPI framework as static throughout market entry risks missing important phase-specific signals. Establish explicit phase gates—predefined metric thresholds—to trigger transitions from validation to scaling, using GTM KPIs as both measurement tools and strategic decision triggers.
Conclusion: Why GTM KPIs Are Your Greatest Competitive Advantage
Measuring your go-to-market strategy with the right GTM KPIs is a strategic capability that builds lasting competitive advantage. Organizations with rigorous KPI frameworks learn faster, iterate more confidently, and allocate resources more effectively than those relying on intuition or lagging indicators. GTM KPIs systematically reduce uncertainty, transforming ambiguous signals into actionable insights. The framework presented—covering market reach, pipeline velocity, conversion efficiency, customer acquisition economics, and early retention—applies across business models and market entry types. The specific metrics you prioritize should align with your go-to-market approach, buyer journey, and current hypotheses. Adapting your framework as you learn is a hallmark of measurement maturity.
Successful companies in new markets are not those with the best initial plan, but those that interpret market signals, adapt quickly, and focus efforts where data directs. Well-designed and consistently reviewed GTM KPIs enable this evidence-driven execution. Build your framework before launching, implement it rigorously, and treat it as a dynamic system. The clarity it provides will be a key advantage in every market you enter.